synapsis
Project overview
synapsis is an R package for analysing fluorescent microscopy images. In particular, its intended use is for analysing meiotic processes in mammals.
The main goal is to objectively count the number of meiotic crossovers on a per cell basis, in line with recent developments in ImageJ software. However, unlike using ImageJ, synapsis does not require a scientist to manually crop images around cells of interest.
Instead, synapsis identifies "good" cells in all images of a data set, crops around each per image, and then performs counting.
A single two channel image might look like the left colour image in the following figure:
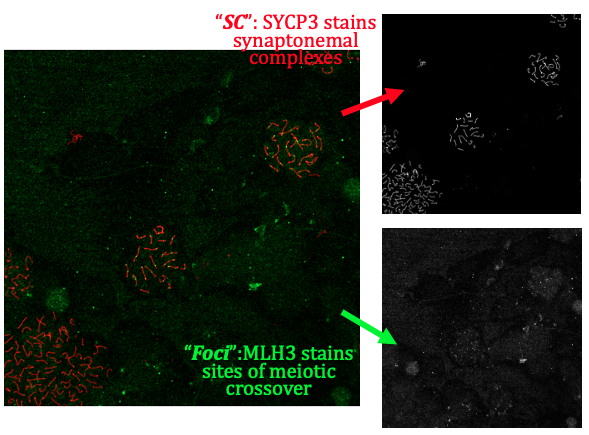
Figure 1: a two channel image of a meiotic spread. Antibody stains are SYCP3 (red, illuminates synaptonemal complexes) and MLH3 (green, illuminates sites of meiotic crossovers). Image taken by Vanessa Tsui in 2020.
which can also be separated into the two channels (greyscale, right).
Synapsis can take this image (or folders of images like this) and determine the number of coincident foci (green) with synaptonemal complexes ("SCs", red) per cell.
Contributors
Lucy McNeill, St Vincent's Institute of Medical Research
Wayne Crismani, St Vincent's Institute of Medical Research and the University of Melbourne
Compatibility
synapsis relies heavily on the bioconductor package EBImage, which currently supports jpeg, png and tiff image files.
Currently, synapsis also supports
- .nd2 (NIKON), see nd2converter.py, which converts a three channel image into three separate jpegs of foci, SC and DAPI (unused) channels from original .nd2 files.
Using synapsis
synapsis has four main functions. These are:
-
auto_crop
-
get_pachytene
-
count_foci
-
measure_distances
We summarise them in the following subsections:
auto_crop
input: Original grey scale image files of (1) Synaptonemal complexes ("SC", e.g. SYCP3 anti-body) and (2) foci (e.g. MLH1, MLH3 anti-body) channels from e.g. Nikon .nd2 files.
output: crops in SC (red) and foci (green) around individual cells.
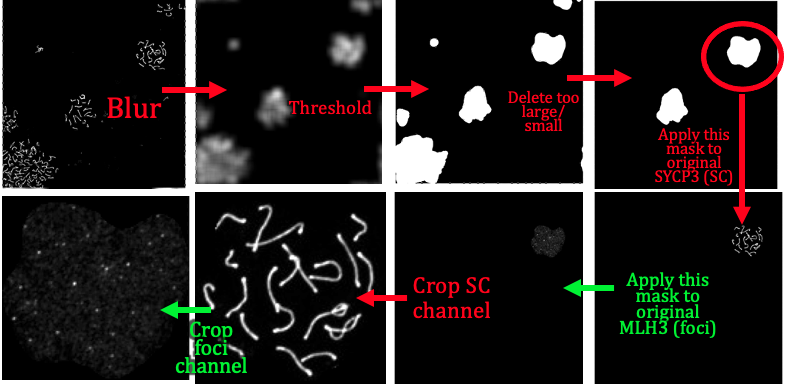
Figure 2: workflow for the auto_crop function. We start with the SC channel (red in Figure 1), and after a series of gaussian smoothing and thresholding, we create a "mask" for each viable cell, i.e. based on brightness. Next we delete candidate cells which are too large (overlapping cells), too small, too oblong (cells on the edge, too dim) etc. Then, we apply each mask on both the SC channel, and the foci channel (green in Figure 1) to isolate single cells of interest. Finally, for each remaining viable single cell, we crop both the SC and foci channel around each single cell.
get_pachytene
input: crops in channels (1) (red) and (2) (green) around individual cells, from previous auto_crop.
output: only keeps crops if cells are in pachytene phase (based on channel (1))
count_foci
input: crops of dna and foci channels in pachytene phase (from get_pachytene)
output: number of foci counts of synamtonemal complexes per cell (i.e. channel 1 coincident with channel 2) as a function of genotype.
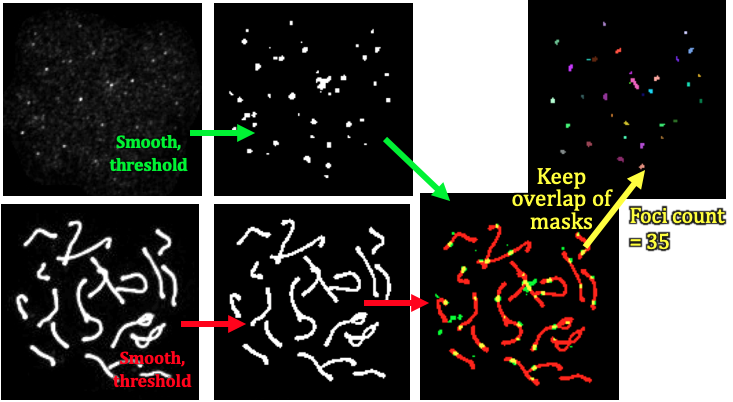
Figure 3: workflow for the auto_crop function. We start with the two crops of the foci and SC channels found in Figure 2. These are also subject to gaussian smoothing followed by thresholding, and then the overlap of these two masks is determined (upper right, multicoloured spots). The function returns the number of coincident foci for this cell.
measure_distances
input: crops of dna and foci channels in pachytene phase (from get_pachytene)
output: a measure of the separation between two foci in the case that they are on the same synaptonemal complex in the SC channel (red).
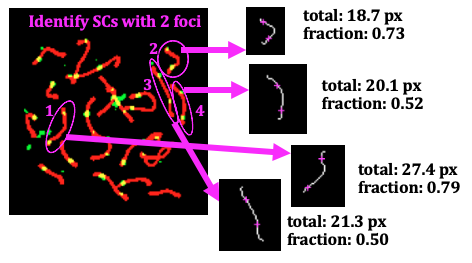
Figure 4: Input and output of the measuring_distance function, for the four SCs that synapsis identifies as having two foci per SC, in this cell. The total length (in pixels) of an SC (white line) is calculated, and the closest point on this line to the foci locations in the original image (left) are drawn with magenta crosshairs. The pixel distance between the two magenta foci locations is calculated. Finally, the function outputs a measure of the distance relative to its own length, i.e. (distance between foci)/(total length of SC).
Analysis
Once we have the foci counts (count_foci) and/or distance between foci along synaptonemal complexes (measure_distances), we can generate
- Histograms
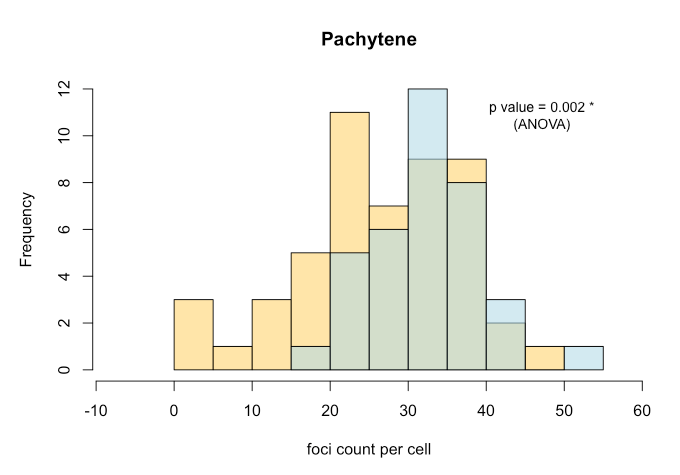
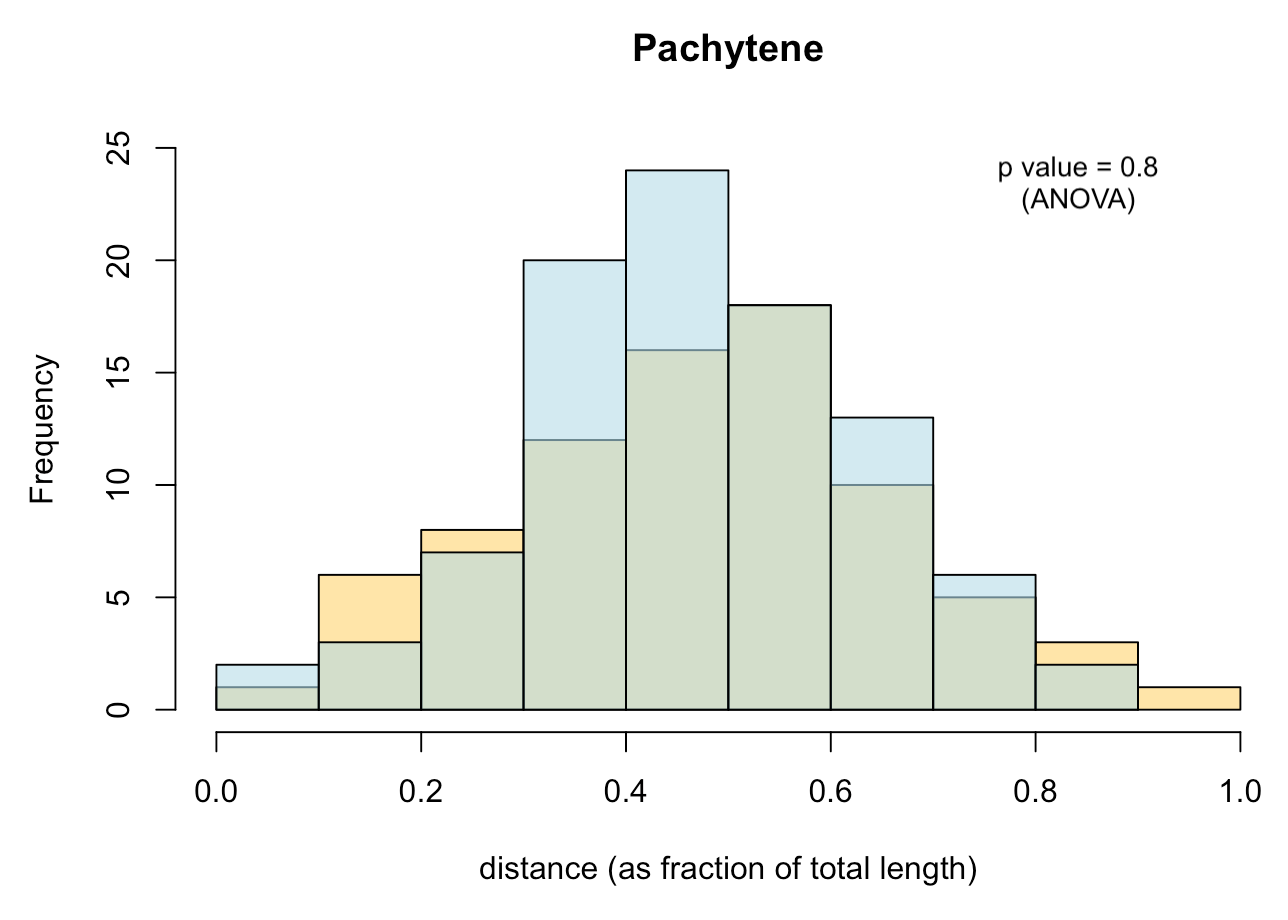
- Boxplots
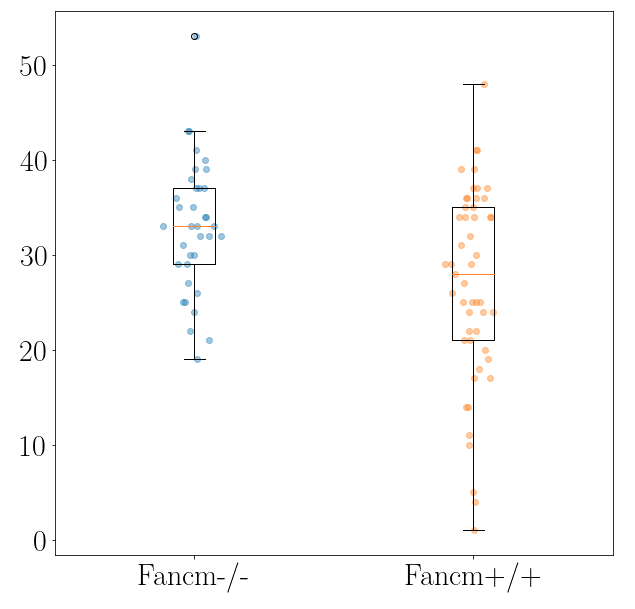
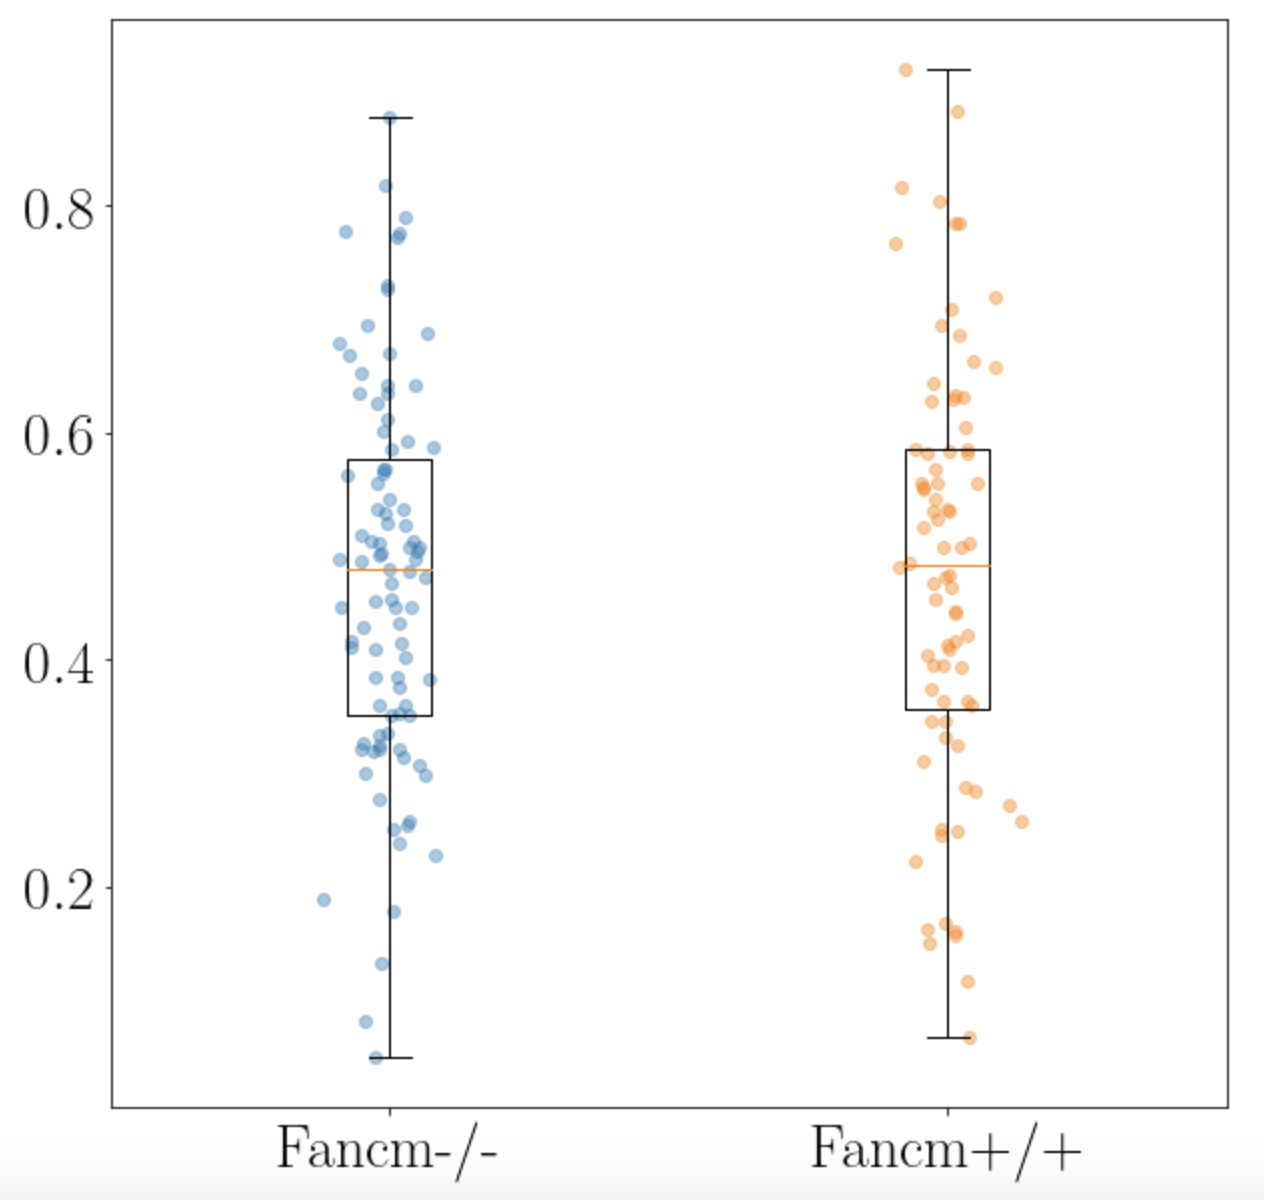
- Measures of statistical significance
with e.g. ANOVA testing.
Project organisation and management
Please issue bug reports through GitLab.
Acknowledgements
This project is a workflowr project, where we make use of a project template created by Davis McCarthy.