synapsis
Project overview
synapsis is an R package for analysing fluorescent microscopy images. In particular, its intended use is for analysing meiotic processes in mammals.
The main goal is to objectively count the number of meiotic crossovers on a per cell basis, in line with recent developments in ImageJ software. However, unlike using ImageJ, synapsis does not require a scientist to manually crop images around cells of interest.
Instead, synapsis identifies "good" cells in all images of a data set, crops around each per image, and then performs counting.
A single two channel image might look like the left colour image in the following figure:
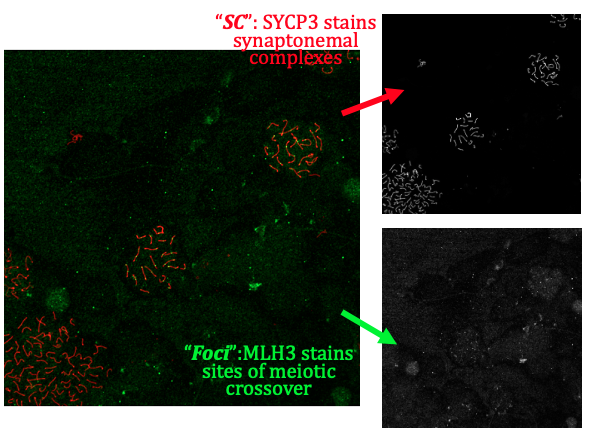 Figure 1: a two channel image of a meiotic spread. Antibody stains are SYCP3 (red, illuminates synaptonemal complexes) and MLH3 (green, illuminates sites of meiotic crossovers).
which can also be separated into the two channels (greyscale, right).
Synapsis can take this image (or folders of images like this) and determine the number of coincident foci (green) with synaptonemal complexes ("SCs", red) per cell.
Contributors
Lucy McNeill, St Vincent's Institute of Medical Research
Wayne Crismani, St Vincent's Institute of Medical Research and the University of Melbourne
Compatibility
Using synapsis
synapsis has four main functions. These are:
-
auto_crop
-
get_pachytene
-
count_foci
-
measure_distances
We summarise them in the following subsections:
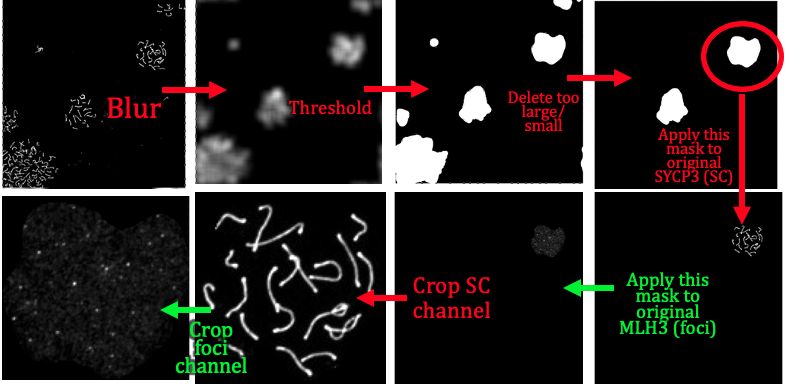
auto_crop
input: Original grey scale image files of (1) Synaptonemal complexes (e.g. SYCP3 anti-body) and (2) Foci (e.g. MLH1, MLH3 anti-body) channels from e.g. Nikon .nd2 files.
output: crops in channels (1) '*dna.jpeg' and (2) '*foci.jpeg' around individual cells.
get_pachytene
input: crops in channels (1) '*dna.jpeg' and (2) '*foci.jpeg' around individual cells, from previous auto_crop.
output: only keeps crops if cells are in pachytene phase (based on channel (1))
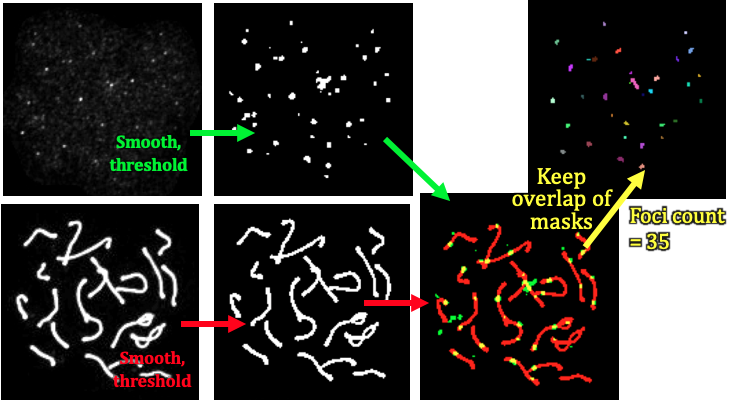
count_foci
input: crops of dna and foci channels in pachytene phase (from get_pachytene)
output: number of foci counts of synamtonemal complexes per cell (i.e. channel 1 coincident with channel 2) as a function of genotype.
measure_distances
input:
output:
Analysis
Once we have the foci counts (count_foci) and/or distance between foci along synaptonemal complexes (measure_distances), we can generate
- Histograms


- Boxplots
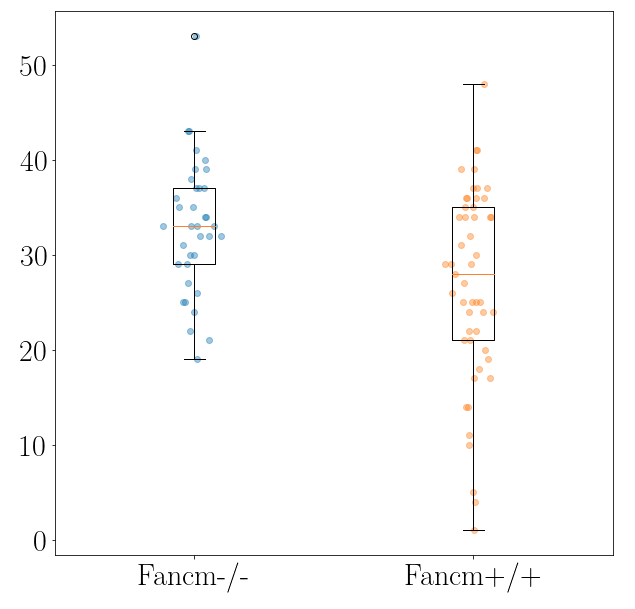
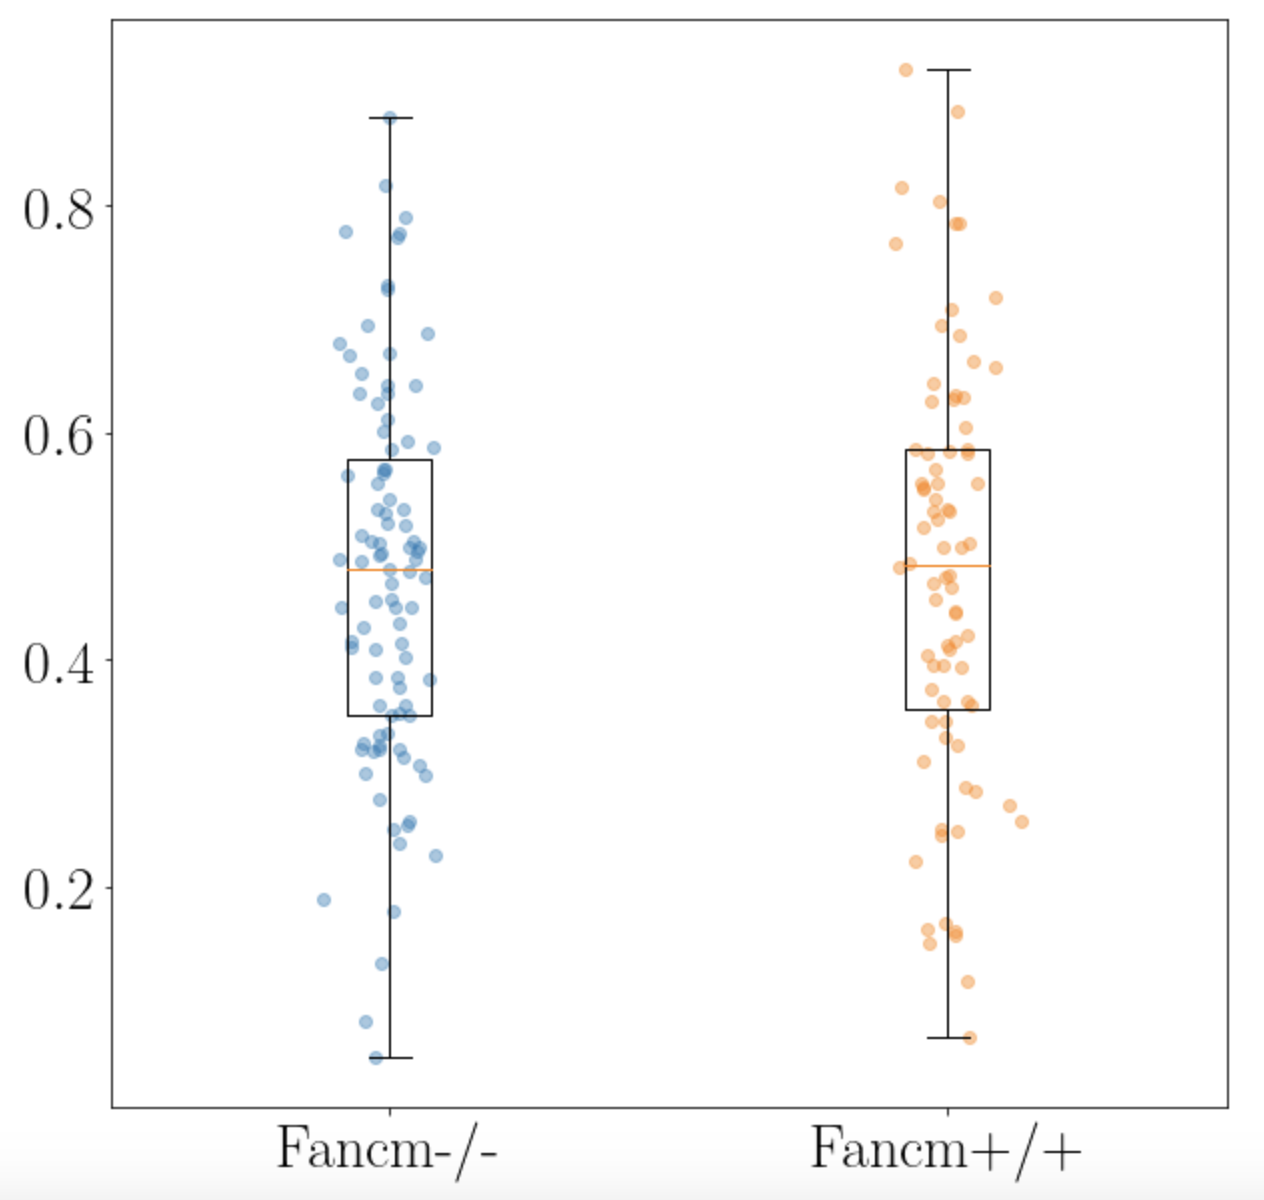
- Measures of statistical significance
with e.g. ANOVA testing.
Project organisation and management
Please issue bug reports through GitLab.
Acknowledgements
This project is a workflowr project, where we make use of a project template created by Davis McCarthy.